With SmartCOP’s law enforcement analytics & reporting software, SmartDATA, agency supervisors, analysts, and command staff can make sense of their critical data. By creating real-time graphs and charts and a user-friendly dashboard, SmartDATA reports allow better decision-making.
SmartCOP’s law enforcement Analytics and Reporting software, SmartDATA, is a vital tool for agency supervisors, analysts, and command staff.
SmartDATA allows data management and reporting capabilities to make informed decisions and help you identify trends and patterns in policing. All of this with real-time analytics.
With a single data entry system, personnel can conduct complete database searches and create customized reports. It is all accessed through the integrated SmartREPORTS module and powered by Crystal Reports.
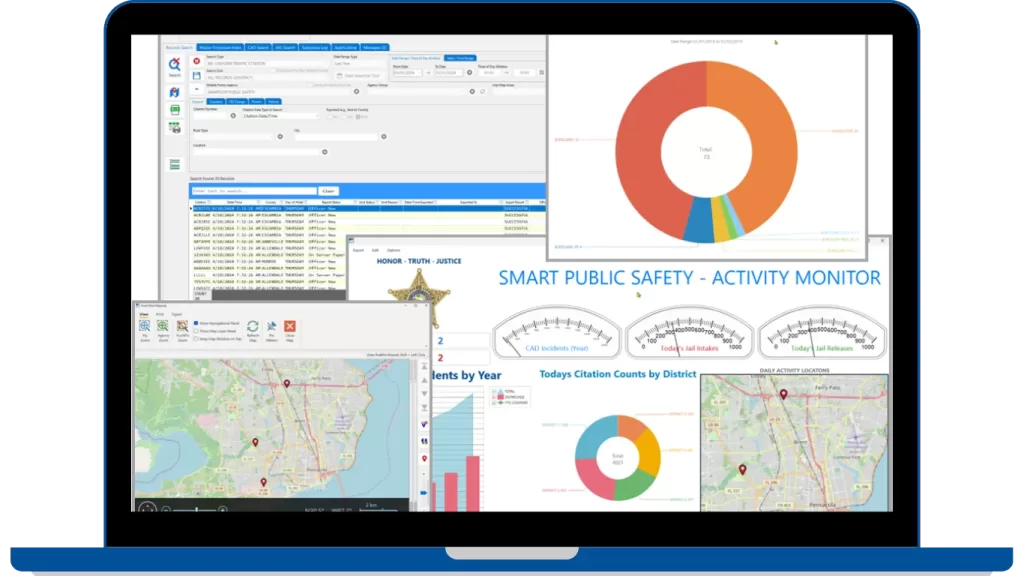
SmartCOP’s reporting software, SmartDATA, offers law enforcement agencies the ability to find, view, map, and analyze critical data across all reports and incidents.
It also enables instant access to records, with powerful search capabilities for locating people, vehicles, and incidents across all SmartCOP systems.
SmartDATA’s mapping feature allows officers to plot data spatially, providing a clear visual for comparing activity patterns.
Agencies can customize and analyze queries and report insights on individual and group performance. These reports are easily exported into Excel, CSV, PDF, and other formats.
The software’s intuitive dashboards support YTD and historical comparisons.
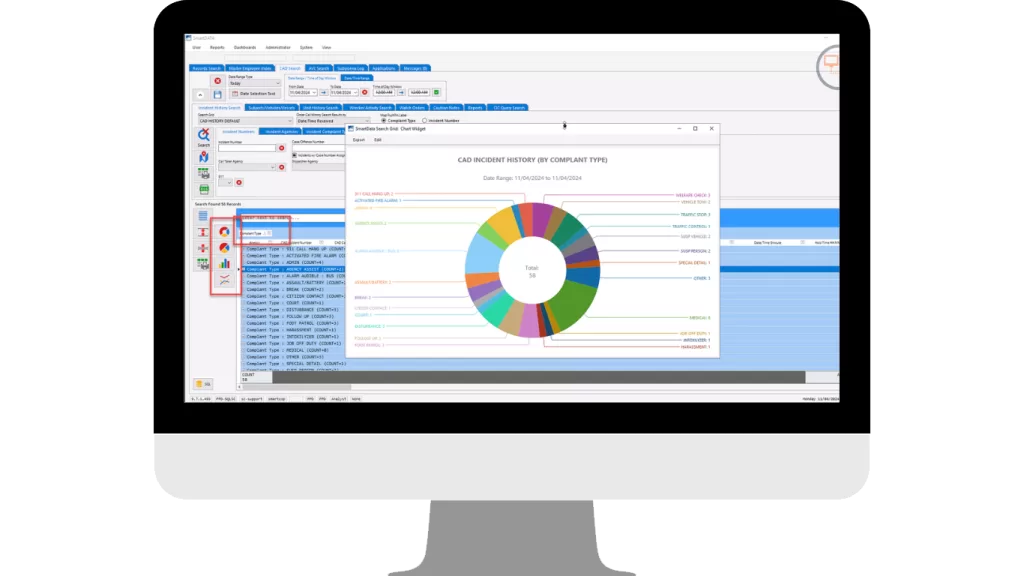
Integration With CAD, RMS, and JMS
SmartDATA is built for intelligence-led law enforcement by providing real-time access to essential data. It is integrated with CAD, RMS, and JMS, allowing users to visualize information through interactive grids, graphs, and multi-layer maps.
Simple export options for deeper analysis, and view related reports by clicking on the results. Also, the map features allow officers to pinpoint and compare event locations.
Hundreds of Pre-Built Reports or Create Your Own
SmartDATA offers a reporting library that houses hundreds of pre-built reports. It draws data from SmartCOP’s CAD, RMS, MCT, and JMS systems.
Agencies can also create custom reports using Crystal Reports, and then integrate them into the system allowing custom insights to meet your operational needs.
Reports can be scheduled to run at set times and automatically sent to key decision-makers. This ensures critical data reaches the right people at the right time.
This automation and flexibility simplify reporting processes, making SmartCOP’s reporting software an important tool for law enforcement decision-making.
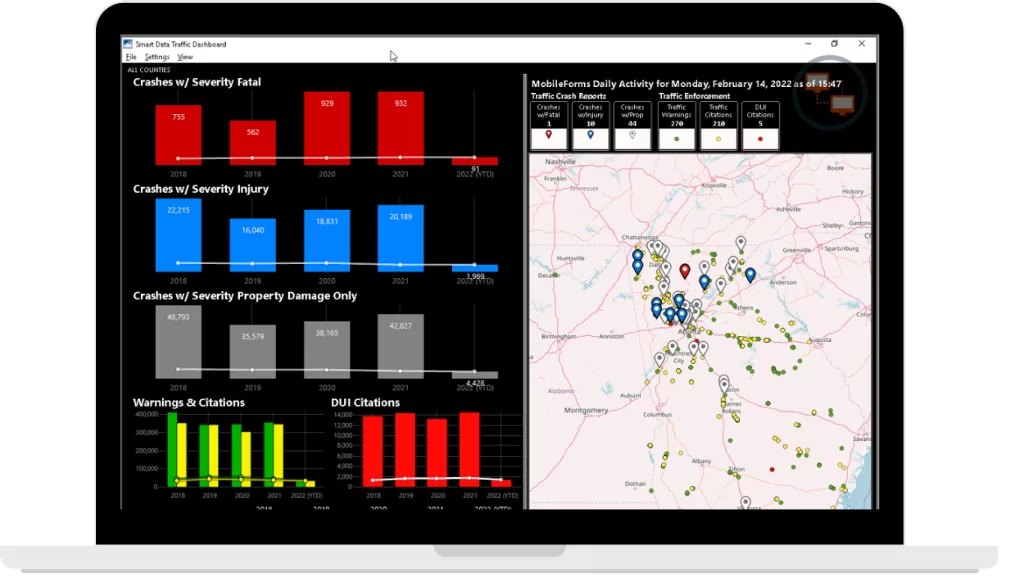
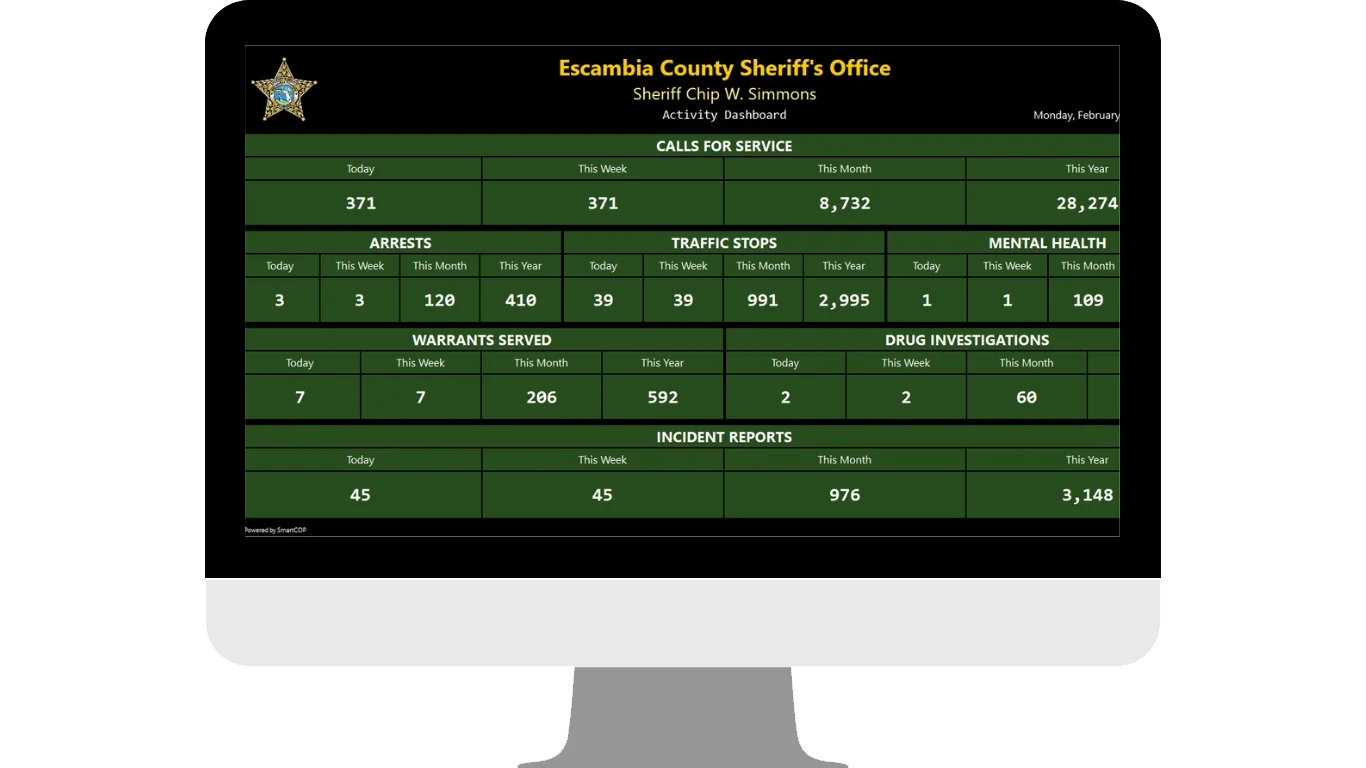
Create Customized Dashboards for Total Visibility
SmartCOP’s law enforcement reporting software provides customizable dashboards that give agencies total visibility into data across their operations.
SmartDATA dashboards deliver real-time updates, making it easy to track performance indicators and analyze trends over time, such as year-to-date and month-to-date comparisons.
Designed to support the specific needs of different roles, permission-based views allow users to access only those items relevant to them.
SmartDATA dashboards are ideal for wall displays, online public web pages, or presentations. It’s a great solution for agencies who want to visualize and communicate key insights.
If you’re ready to make your job easier by having a reporting tool that can be customized for your needs, complete the form below. A member of our team will reach back out to answer questions, schedule a demo, or provide a quote.